LACE Photo Media
Website Design + Photography + Social Media Firm

INSTAGRAM STATISTICS + ANALYTICS
FOLLOWER GROWTH
+736 followers in just under three months
1/24/19 2,341
4/24/19 3,125
Follower Insights:
+Surprise Finding: Giveaways accounted for only +/- 21 total followers
+Approximately 245 followers per month/20 followers per week gained
+As accounts grow, their rate of growth tends to increase - as social proof increases - more people want to follow and more accounts are tagged/recommended by existing followers. It really is a snowball effect! Let’s keep it going!

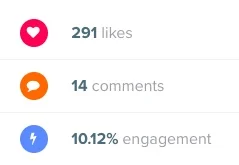
ENGAGEMENT RATES
Average post engagement rate of 7-8%
Engagement Rate findings:
+Congrats! According to Instagram and average business account engagement; This is a very healthy engagement range for business accounts!
+This average removes giveaways from the equation so as not to skew the average. Your Valentine’s giveaway averaged 30% engagement mainly due to the comment tags.
POST ANALYTICS
Your Best Performing Posts Were:


Additional Post Highlights

Grumpy Valentine
This post reached nearly 1,500 people organically, with 20% of the accounts reached, not already following you. 17 people sent this post as a direct message to their friends and three people bookmarked the post to save for later. This post caught the attention of Visit Vortex, garnering a repost to their 20K followers. This post saw 2% higher engagement than on average.


Color Changing Cocktail
This post reached more than 3,000 accounts organically, with more than half of the accounts reached, not already following you. 18 people sent this post as a direct message to their friends and 11 people bookmarked the post to save for later. You received nearly 90 profile visits, 7 followers and 2 users asking for directions. This post caught the attention of three local magazines (HV Mag, Upstater, Chronogram) and was reposted by Chronogram’s sister issue, The Upstater. This post put the Mercantile on Chronogram’s radar and ultimately led to the bar’s recent feature as the ‘Cocktail of the Month’ for their April issue online and in print.


Game Night
This post reached more than 2,000 accounts, with more than half of the accounts reached, not already following you. Five people sent this post as a direct message to their friends and four clicks were generated to your website, with two users seeking directions. This post also encouraged nearly 80 users to click on your profile and made users aware of a special, recurring night.


The Giveaway
This post was created within the first month of management while we were getting to know your user base, the account’s algorithm, and high times to post. This post reached nearly 1,500 accounts, with most of the accounts already following you, however, this post specifically brought on 12 new followers and garnered more than 100 overall comments and more than 300 likes. This post reminded veteran customers of your unrivaled service, delicious food, and mouthwatering cocktails, garnering multiple comments from users interested in stopping in again soon.


Overall Post Findings:
+Surprise Finding: Your top two posts performed even better than giveaway posts when it came to likes!
+Your best performing posts are the cocktail posts. They received the most likes, saves, and shares.
+Your second best performing posts are posts with people featuring snarky commentary about the cocktail boys.
+Interesting FACT: The most liked posts don’t necessarily have higher click through rates.
+Average click through rates: 90 profile visits, 3 private messages and 2 saves
WEBSITE CLICKS
Since February 15th, more than 100 Website Clicks originated from Instagram and went directly to your website!
This number does not include the number of website clicks received prior to creating the bit.ly link (43) and our typical call to action is to stop into the Mercantile in person, not to visit the website, so this is done by users without prodding, which is HUGE! On average, your account saw 10 or more get directions clicks per week - that’s an estimated 120 clicks in 12 weeks and a possible 240+ visitors in that time span alone.

